|
Stocking Rate
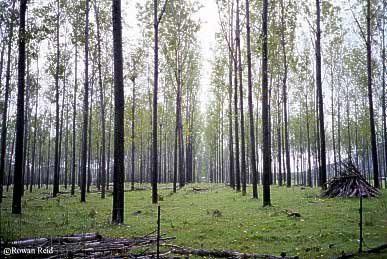
Poplar plantation, NSW
The tree density or stocking rate of a forest
is described as the number of trees per hectare. This can
be easily calculated for each plot as follows:
Stocking rate (stems/ha) = Trees in plot /
Plot area (ha)
For example: if there were 30 trees in a 20
x 15 metre rectangular plot then the stocking rate would be:
Stocking rate (stems/ha) = 30/[(20x15)/10000*)]
= 30/0.03 = 1000 stems/ha
*Note that the plot area must be in hectares
(hence the division by 10000)
If trees are established in a regular pattern
and there have been no losses, then the stocking rate can
be estimated from the initial spacing:
Stocking rate (stems/ha) = (100/Spacing
between rows) x (100/Spacing within rows)
For example: if a plantation was established
at a spacing of 4 by 5 metres then the stocking rate would
be:
Stocking rate (stems/ha) = 100/4 x 100/5 =
25 x 20 = 500 stems/ha
In belts the stocking rate might be better described
as the number of trees per 100 metres of belt.
If stocking rate is the only factor of interest
it may not be necessary to establish fixed area plots. ‘Point-to-plant’
sampling is an effective and efficient technique for assessing
stocking rate. This technique involves measuring the distance
from an identified ‘plot point’ to the forth closest
tree. To calculate the stocking rate for each plot the formula
is:
Stocking rate (stems/ha) = (n - 0.5) x 10000/(3.142xd2)
Where:
n = number of trees in each stocking plot
(4 if the distance to the forth tree was measured)
d = distance to the nth tree in metres
Therefore, if the distance to the 4th tree were
5 metres then the equivalent stocking rate would be:
Stocking rate (stems/ha) = (4 - 0.5) x 10000/(3.142x52)
= 35000/78.55 = 446 stems/ha
Because stocking plots can be done quite quickly,
it is possible to do many measurements systematically across
the whole forest to get a precise measure of the stocking
rate. This method can also be used to determine the variability
in stocking rate across the site. This is important in determining
the number of fixed area plots required for more detailed
measurements such as diameter, height and volume.
Back to top
|